
Ion Implantation Fabrication, Characterization, and Control Mechanisms of SiC Color Centers +
4H-SiC epitaxial wafers are available for color center researches. Please contact: [email protected] for wafer specifications.
Silicon carbide (SiC), as a wide-bandgap semiconductor material, holds significant application value in high-temperature, high-power electronic devices. In recent years, color centers formed by point defects in SiC have garnered considerable attention due to their great potential in fields such as quantum information, sensing, and metrology. Particularly, defects like the silicon vacancy (VSi), divacancy (VCVSi), and antisite-vacancy pair (CSiVC) are ideal candidates for building solid-state quantum systems, owing to their excellent spin coherence properties and room-temperature single-photon emission characteristics. This paper synthesizes recent research, reviewing the ion implantation fabrication methods, spectroscopic and microstructural characterization techniques, defect formation and evolution mechanisms of SiC color centers, as well as progress in controlling their performance through annealing and dual-ion implantation.
1. Main Methods for Ion Implantation Fabrication of SiC Color Centers
Ion implantation is a primary technical route for fabricating SiC color centers, offering advantages such as precise positioning, controllable dosage, and compatibility with semiconductor processes. Depending on the type and mass of the implanted ions, strategies can be categorized into light ion implantation, heavy ion implantation, and dual-ion implantation.
1.1 Helium Ion Implantation
Helium ions (He+) are considered an effective method for fabricating VSi centers due to their light mass, chemical inertness, and relatively low lattice damage. Fan et al. investigated the formation mechanism of VSi during He+ implantation into 4H-SiC using Molecular Dynamics (MD) simulations. They found that incorporating electronic stopping effects significantly improved simulation accuracy and proposed a new statistical method for VSi based on surrounding structural integrity, which proved more accurate than the traditional Wigner-Seitz method. Experimentally, Song et al. implanted 30 keV helium ions into 4H-SiC using a Helium Ion Microscope (HIM). They observed the characteristic emission peak of VSi within the 850–950nm range via Photoluminescence (PL) spectroscopy and revealed helium bubble formation and surface swelling effects under high-dose implantation using confocal Raman spectroscopy and Atomic Force Microscopy (AFM). The study also found that the VSi yield increased linearly with dose up to a threshold of 1×10¹⁵cm⁻²; beyond this, color center yield decreased due to defect cluster formation and amorphization.

Fig. 1 Trend of VSi color center count as a function of helium ion implantation dose from MD simulation
1.2 Hydrogen Ion Implantation
Hydrogen ion (proton) implantation, with its high ionization energy loss rate, is also widely used for color center fabrication as it favors the formation of charged vacancies and has a relatively small impact on surrounding lattice quality. Sun et al. systematically studied the variation in yields of VSi and VCVSi with implantation fluence by performing 250keV proton implantation into 4H-SiC combined with PL and Electron Paramagnetic Resonance (EPR) characterization. The experiment found that at a flux of 1×10¹⁵cm⁻², the PL signals of VSi and VCVSi were the strongest, while the number of VC and VCVSi first increased and then decreased with the flux, consistent with the experimental results.
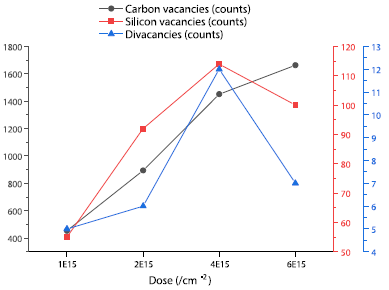
Fig. 2 MD simulation curves showing the variation in VSi, VCVSi, and VC counts with hydrogen ion implantation fluence
1.3 Heavy Ion Implantation
Heavy ion implantation (e.g., Ge, Sn) can generate high-concentration damage in near-surface regions, inducing intrinsic defect aggregation to form novel luminescent centers. Kobayashi et al., after implanting 350keV Ge and 700keV Sn ions into 4H-SiC and performing high-temperature annealing above 1700°C, observed three sharp PL emission lines (DI1-3) within the 1002–1006nm range. These DI lines appeared only in samples with damage concentrations exceeding 10²² cm⁻³ and were independent of the implanted ion species, indicating their origin from high-damage-induced intrinsic defect clusters. Through stepwise annealing experiments, the study also revealed an evolution path: VSi transforms into VCVSi or CSiVC around 1000°C, further into TS defects at 1200°C, and finally into DI defects at 1700°C.

Fig. 3 Evolution of PL intensities for VSi, VCVSi, CsiVC, TS, and DI defects under different annealing temperatures
1.4 Dual-Ion Implantation
To precisely control the depth distribution of color centers and enhance their yield in near-surface regions, dual-ion implantation strategies have emerged. Sun et al. studied the synergistic effect of carbon ion (C) pre-implantation followed by hydrogen ion (H) implantation using MD simulations. Results showed that low-fluence (5×10¹³cm⁻²) carbon pre-implantation could increase the yields of VSi and VCVSi in subsequent hydrogen implantation while suppressing VC generation, which is beneficial for balancing color center performance and device electrical properties. SRIM simulations also confirmed that C+H dual-ion implantation allows controllable adjustment of defect distribution from shallow to deep layers.

Fig. 4 SRIM-simulated depth profiles of damage (vacancy) atoms produced in 4H-SiC by dual-ion implantation with different C to H ion fluence ratios

Fig. 5 Comparison between single-ion implantation and C+H dual-ion implantation: (a) damage atom distribution, (b) VSi depth distribution, (c) VC depth distribution
2. Spectroscopic and Microstructural Characterization of SiC Color Centers
2.1 Photoluminescence Spectroscopy
PL spectroscopy is the primary method for identifying and quantitatively analyzing SiC color centers. VSi typically exhibits a broad emission band around 850–950nm at room temperature, with its Zero-Phonon Line (ZPL) clearly resolvable at low temperatures. VCVSi PL signals are located around 1.1μm (e.g., PL4 line), while CSiVC emissions are in the visible range (approx. 650–680nm). Three-dimensional spatial distribution of color centers can be reconstructed via confocal PL depth profiling and 2D mapping. Song et al. found that VSi signals concentrated at the center of the implanted region after low-dose helium implantation, whereas under high doses, due to helium bubble formation, the signal distribution exhibited a “weak center, strong periphery” feature.
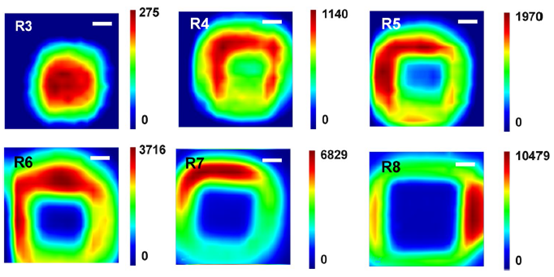
Fig. 6. 2D distribution maps of VSi PL signals after helium ion implantation with different doses
2.2 Raman Spectroscopy
Raman spectroscopy can assess lattice damage induced by ion implantation. After high-dose implantation, the intensity of the SiC E₂ mode decreases, and a D peak appears around 1390cm⁻¹ corresponding to C–C bond vibrations, indicating the formation of sp²/sp³ hybridized bonds and lattice disorder. This peak position blueshifts when the excitation wavelength changes from 532nm to 638nm, consistent with the double-resonance Raman scattering feature of carbon materials. Additionally, signals from Si–Si bonds in the 480–520cm⁻¹ range intensify with implantation dose, further confirming impaired lattice integrity.

Fig. 7 Raman spectra of 4H-SiC after helium ion implantation with different doses, obtained under 532nm and 638nm laser excitation
2.3 Electron Paramagnetic Resonance
EPR can directly probe defect states with unpaired electrons. Sun et al. performed EPR measurements on proton-implanted 4H-SiC and observed characteristic resonance peaks for VC around g≈2.0036–2.0038. Their intensity increased monotonically with implantation fluence, differing from the trend in color center yields shown by PL results. This suggests VC plays a crucial role in color center formation, but its excessive generation may degrade device electrical performance.
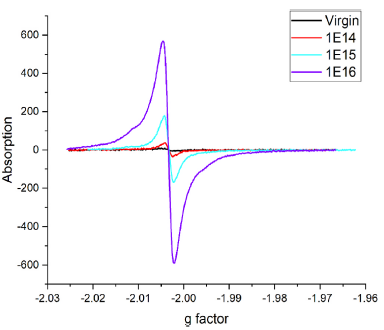
Fig. 8 Electron paramagnetic resonance spectra of 4H-SiC samples after 250keV proton implantation with different fluences (1E14, 1E15, 1E16cm⁻²)
2.4 Atomic-Scale Simulation and Visualization
MD simulations combined with visualization tools (e.g., OVITO) can reveal the dynamic evolution of defects during implantation and annealing at the atomic scale. Fan et al. demonstrated the processes of collision cascades, local temperature rise, and defect cluster formation during helium ion implantation (Figs. 9, 10). Sun et al. utilized atomic trajectory playback to visually present the generation mechanism of VCVSi: after adjacent C and Si atoms are displaced by proton impact, the C atom fills a neighboring lattice site while the Si atom becomes an interstitial, thereby forming the divacancy.

Fig. 9 Evolution of local temperature field distribution during single He⁺ ion implantation into 4H-SiC: (a) without considering and (b) considering electronic stopping effects
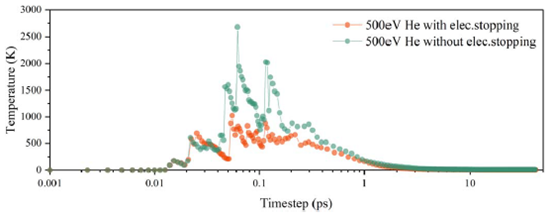
Fig. 10 Variation curve of the system’s local maximum temperature over time during He⁺ ion implantation

Fig. 11 Atomic trajectory diagram from MD simulation revealing the generation mechanism of VCVSi during proton implantation
3. Regulation of SiC Color Center Formation and Transformation via Annealing
Annealing is a key post-processing step for repairing lattice damage and promoting the formation of specific color centers. Multiple studies indicate different optimal annealing temperature windows for different color centers.
3.1 Annealing Behavior of VSi
Fan et al. found through MD simulations that after 1×10¹⁵cm⁻² helium ion implantation, annealing at 993 K maximized the number of perfect VSi (surrounded by four intact C atoms in a tetrahedral configuration), a temperature consistent with experimental results from Wang et al. (Figs. 12 & 13). During annealing, VSi can combine with migrating VC to form VCVSi or transform into CSiVC via neighboring C atoms jumping into the vacancy.
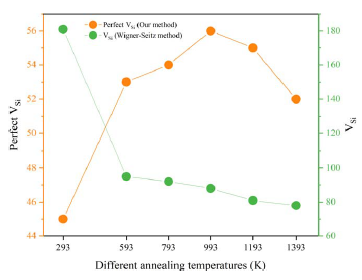
Fig. 12 Variation curves of Perfect VSi counts obtained by the new statistical method and total VSi counts obtained by the traditional Wigner-Seitz (WS) method at different annealing temperatures

Fig. 13. (a) Atomic configuration and (b) depth distribution of perfect VSi and its surrounding four carbon atoms at the optimal annealing temperature (993 K)
3.2 Defect Transformation Chain
Research by Kobayashi and Sun collectively reveals a stepwise defect transformation sequence under high-temperature annealing:

Here, the TS defect is a stable luminescence center (ZPL ~769–813nm) appearing after proton implantation, while the DI defect is an intrinsic cluster induced by heavy ion implantation and high damage. MD simulations also confirm that during annealing at 2293K, some VSi directly transforms into VCVSi while VC count decreases, indicating high temperature aids in optimizing color center composition.
4. Advances in Electronic Stopping Effect and Defect Statistical Methodology
4.1 Simulation Considerations for Electronic Stopping Effect
In light ion implantation simulations, electronic stopping significantly impacts ion energy loss, range, and defect yield. Fan et al., through comparison of SRIM and MD simulations, pointed out that neglecting electronic stopping leads to overestimation of local temperature and deeper predicted defect peaks. Incorporating an electronic stopping model improved the agreement between MD-simulated damage distributions and SRIM results, significantly enhancing simulation prediction accuracy.
4.2 New Methods for Defect Identification and Statistics
The traditional Wigner-Seitz method is prone to misjudgment under amorphization or large elastic deformation. Fan’s team proposed a new VSi statistical method based on surrounding structural integrity: using the four coordinated C atoms as a criterion, counting only VSi surrounded by at least one complete layer of crystal lattice. This method can accurately identify color centers even during annealing-induced volume changes, providing a more reliable tool for quantitative study of color center formation and evolution.
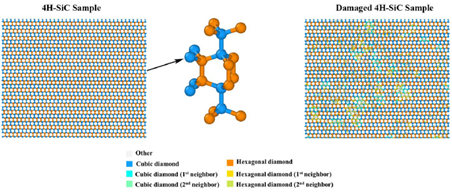
Fig. 14 Atomic structure of a 4H-SiC sample analyzed via the “Identify Diamond Structure (IDS)” method
Currently, research on SiC color centers, through various ion implantation strategies (He, H, Ge/Sn, C+H), multi-dimensional characterization techniques (PL, Raman, EPR, AFM, MD simulation), and precise annealing processes, is progressively revealing the formation mechanisms, evolution pathways, and control methods of color centers, promising to provide a robust material platform for next-generation quantum technologies.

Whether you need 4H-SiC wafer for research or for industrial applications, please contact us email at [email protected] and [email protected].
References:
- Fan, Y., Song, Y., Xu, Z., Wu, J., Zhu, R., Li, Q., & Fang, F. (2021). Numerical study of silicon vacancy color centers in silicon carbide by helium ion implantation and subsequent annealing. Nanotechnology, 33(12), 125701.
- Sun, T., Xu, Z., Wu, J., Fan, Y., Ren, F., Song, Y., … & Tan, P. (2023). Divacancy and silicon vacancy color centers in 4H-SiC fabricated by hydrogen and dual ions implantation and annealing. Ceramics International, 49(5), 7452-7465.
- Kobayashi, T., Rühl, M., Lehmeyer, J., Zimmermann, L. K., Krieger, M., & Weber, H. B. (2021). Intrinsic color centers in 4H-silicon carbide formed by heavy ion implantation and annealing. Journal of Physics D: Applied Physics, 55(10), 105303.
- Song, Y., Xu, Z., Li, R., Wang, H., Fan, Y., Rommel, M., … & Fang, F. (2020). Photoluminescence and Raman spectroscopy study on color centers of helium ion-implanted 4H–SiC. Nanomanufacturing and Metrology, 3(3), 205-217.